In the interactive tour, you can run
the Console and the BigTel App side-by-side, to get a good idea
of how the Console helps you monitor system activity. Here we
show some screen shots of the Console that track the BigTel
demo.

Here are some areas of interest that you can check out on the WebLogic Server Console while the BigTel App is running:
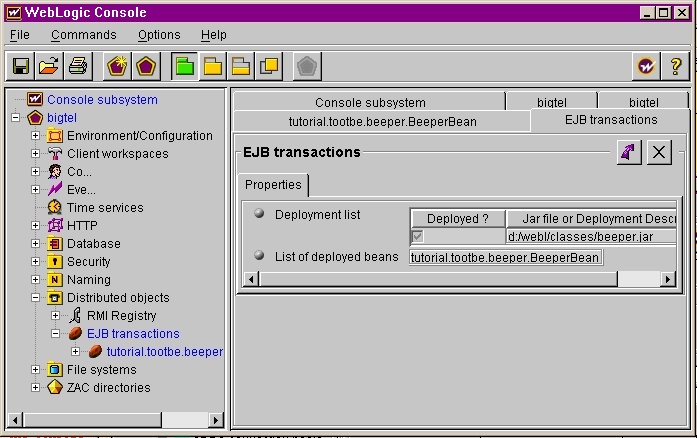
The EJB transactions folder
The EJB transactions folder shows general information about the deployment of the EJBean used for the Beeper applet. You'll also see the transactions for the tutorial.tootbe.beeper.Bean, including its type, how it is bound in the JNDI tree, names of its classes and interfaces, and its state.
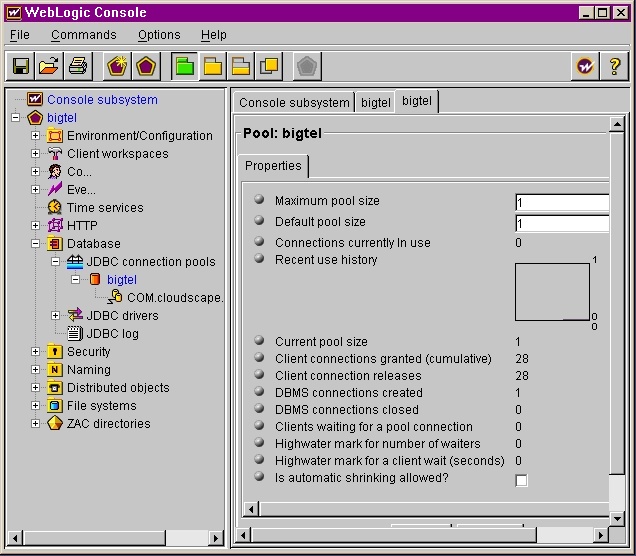
The Database folder
In the JDBC pools folder, you can see the description of the connection pool that the BigTel app is using. The number of connection requests and releases in the Console shows how many times we've connected using a connection from the pool. Each use is only a few milliseconds long.
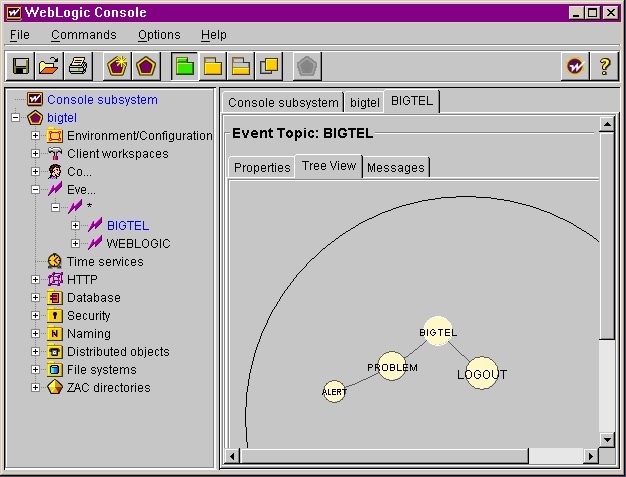
The Events folder
This displays WebLogic Server's Topic Tree, which is an n-ary tree that descends from most general -- the asterisk you see at the top of the tree -- to more specific. The BigTel folder shows registrations that we used in this demo for the Beeper applet and for logging in and logging out of field engineers.
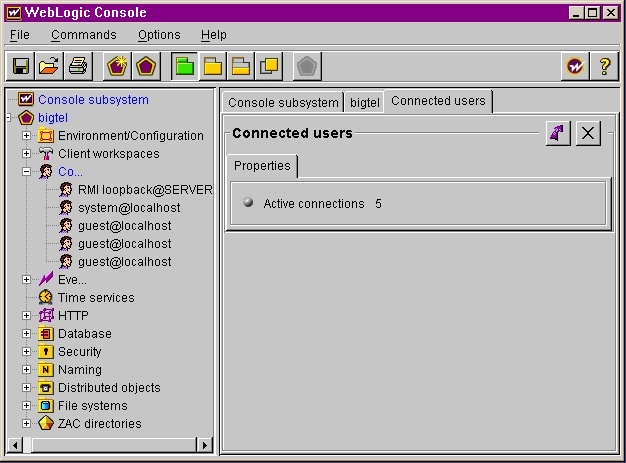
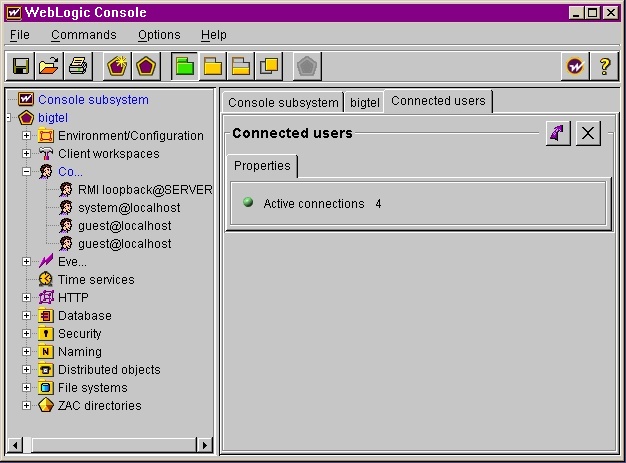
The Connected Users folder
Here you can see how many connections are currently open to the WebLogic Server.
After we close the BigTel App, the number of connected users decreases immediately.
Mr. Imayess and Ms. Veep were nodding. "There's a lot of information here," Ms. Veep said.
"I'll leave it running and you can check it out," the Java engineer said. "Let me tell you what we've got planned for next week!"